How can we help you today?
 
Search

Consolidated financial highlights 

Snapshot of Results

Profitability(%) 2022 1Q23 1H23 9M23 2023
ROE 54,7 27,9 39 41,2 37,9
ROE, Quarterly 62,3 27,9 50,3 45,5 30
ROA 6,2 3,6 4,7 4,9 4,4
ROA, Quarterly 7,9 3,6 5,8 5 3,3
Swap Adj. NIM 8,2 4,84 4,3 5,3 4,7
Swap Adj. NIM, Quarterly 11,1 4,84 3,8 6,8 3,4
CIR (1) 19 40,3 32 30 32,7
CIR, Quarterly 19,4 40,3 26,4 27,3 40,8
(%)          
Total LDR (2) 82 80 74 73 71
TL (2) 106 96 87 85 83
FX 51 54 56 55 53
Leverage (x) 7,5 8,2 9 9 9
Asset Quality(%)          
NPL Ratio 2,8 2,5 2,1 2 2,2
Stage 3 Coverage 67,6 69,7 70,1 70,7 62,1
Stage 2/Total Gross Loans 6,6 6,1 6,6 7 6,4
Stage 2 Coverage 16,4 18,5 18,5 17,1 16,6
Net CoC 0,81 1,35 1,64 1,42 1,4
Net CoC, Quarterly 0,89 1,35 1,91 1,06 1,36
Net CoC (excl. Currency) 0,54 1,25 1,14 1,07 1,07
Net CoC(excl. Currency), Quarterly 0,66 1,25 1,05 0,94 1,08
Solvency (3) (%)          
CAR 20,9 18,6 17,1 18,4 18,5
CET-1 17,9 15,7 14,9 15,5 15,6
Tier-1 17,9 15,7 14,9 15,5 15,6

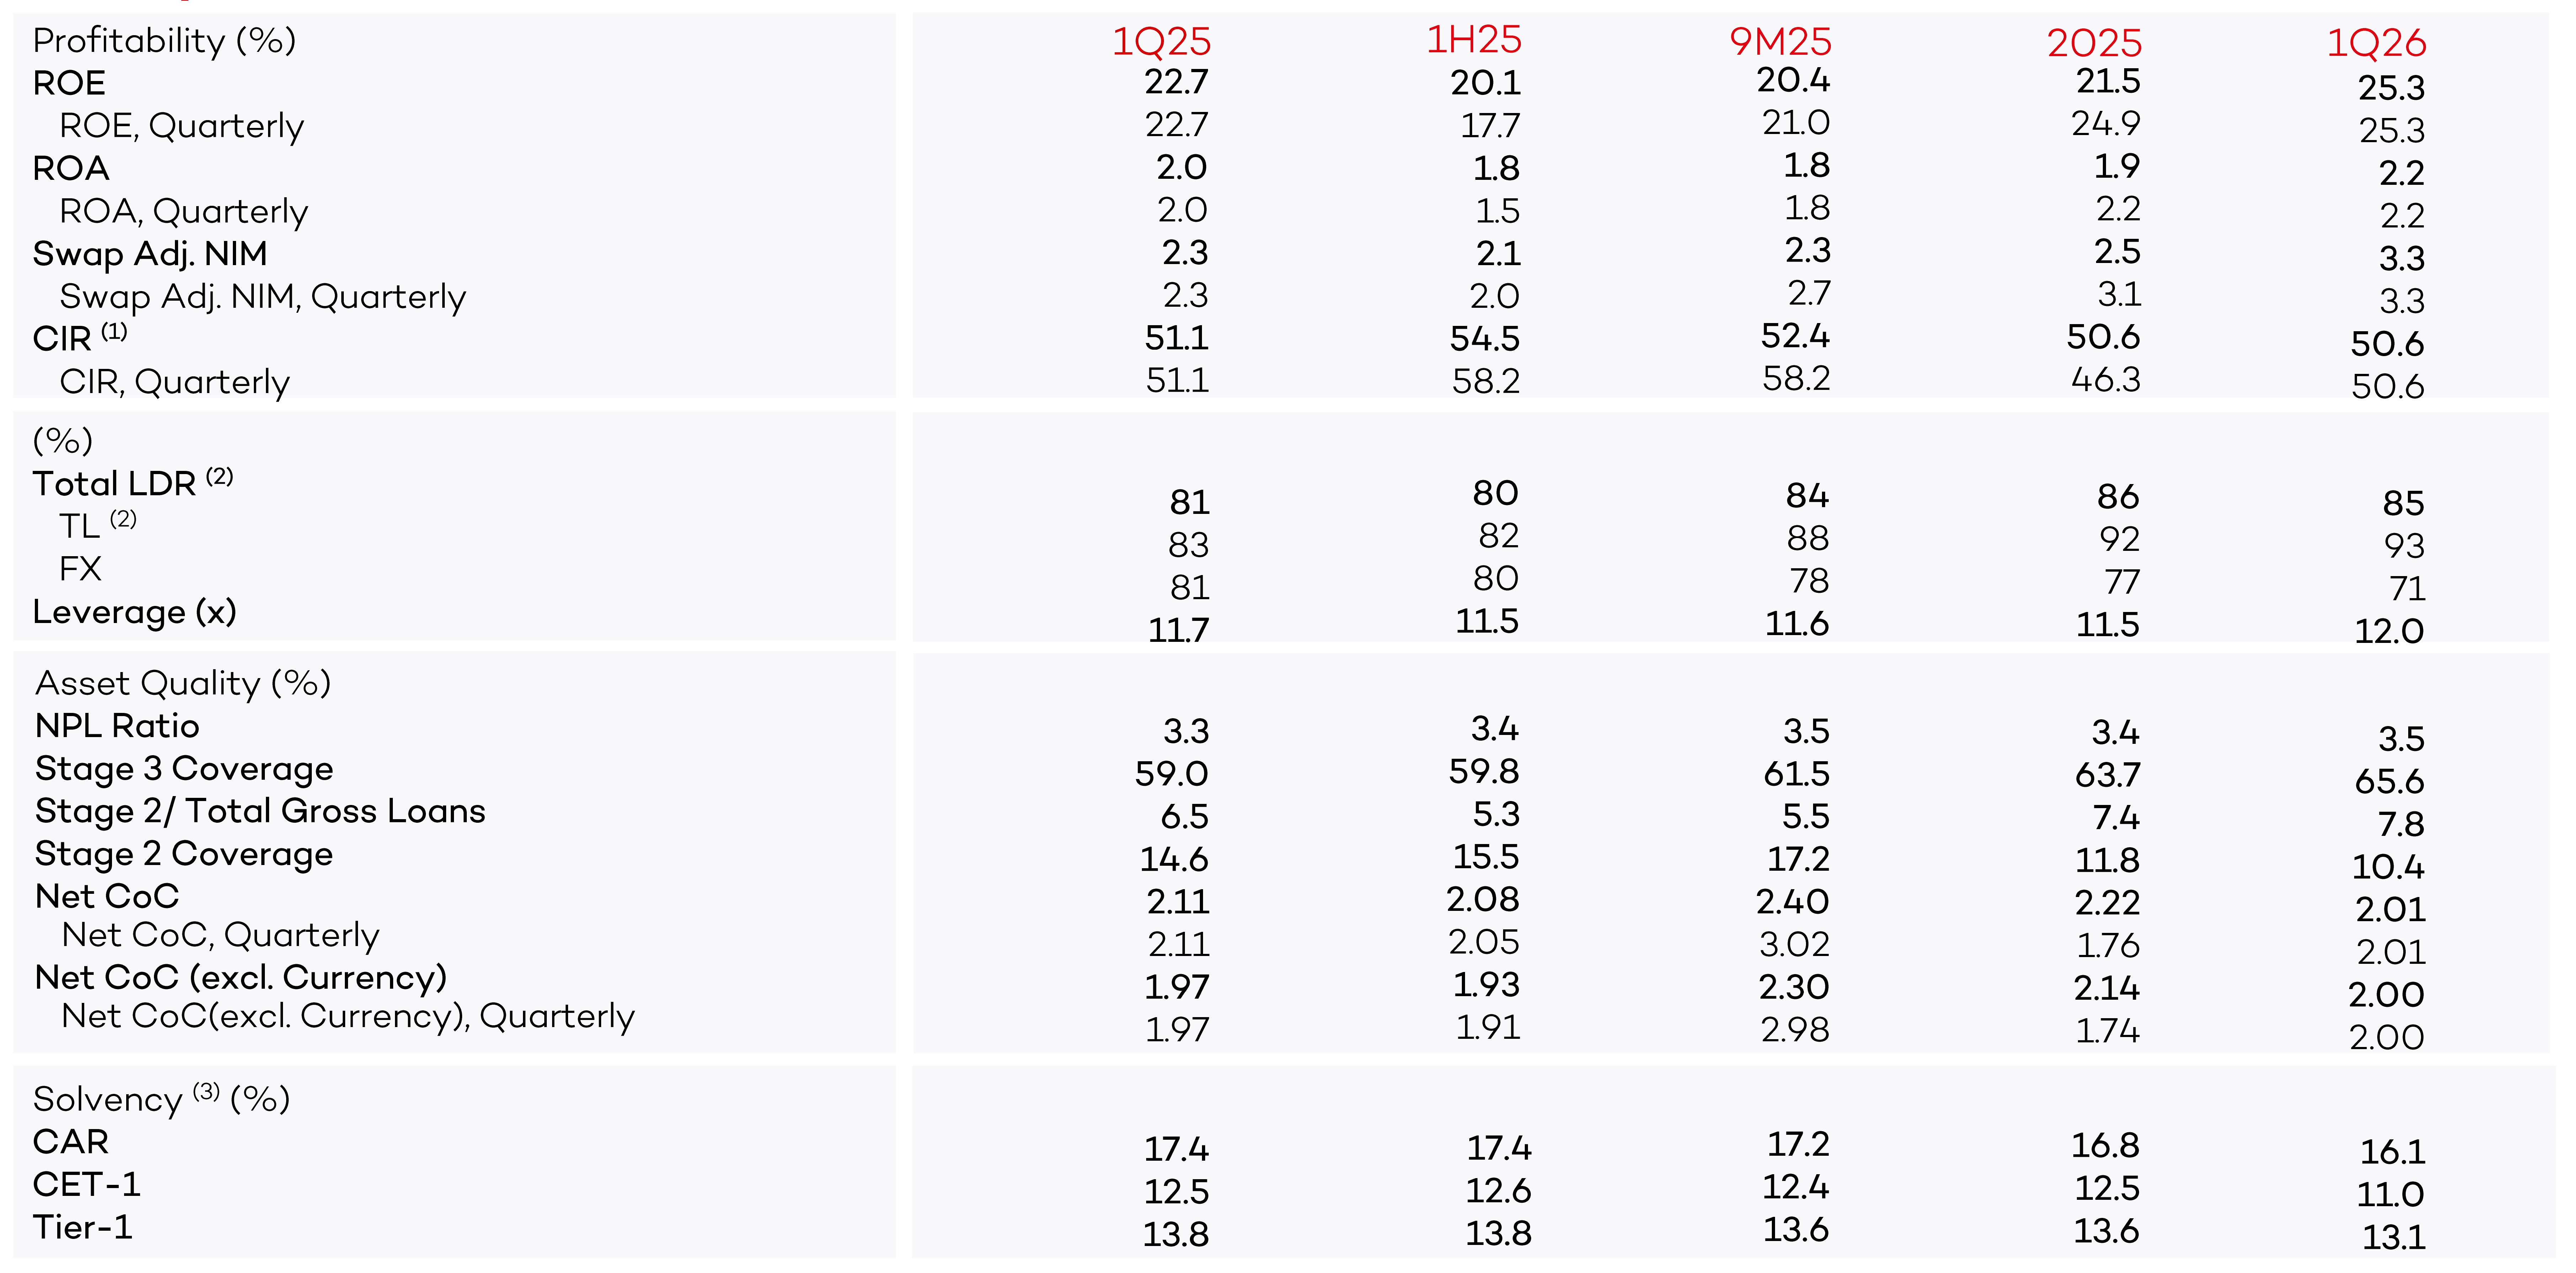
(1) CIR calculation excludes FX gain from hedge position related with stage 1&2 provisions
(2) Bank-only, TL LDR includes domestic TL bond issuances and merchant payables
(3) w/o forbearances: Fixing MtM losses of securities & FX rate for RWA calculation to 2021YE FX rate for 2022; fixing MtM losses of securities & FX rate for RWA calculation to 2022YE FX rate for 2023

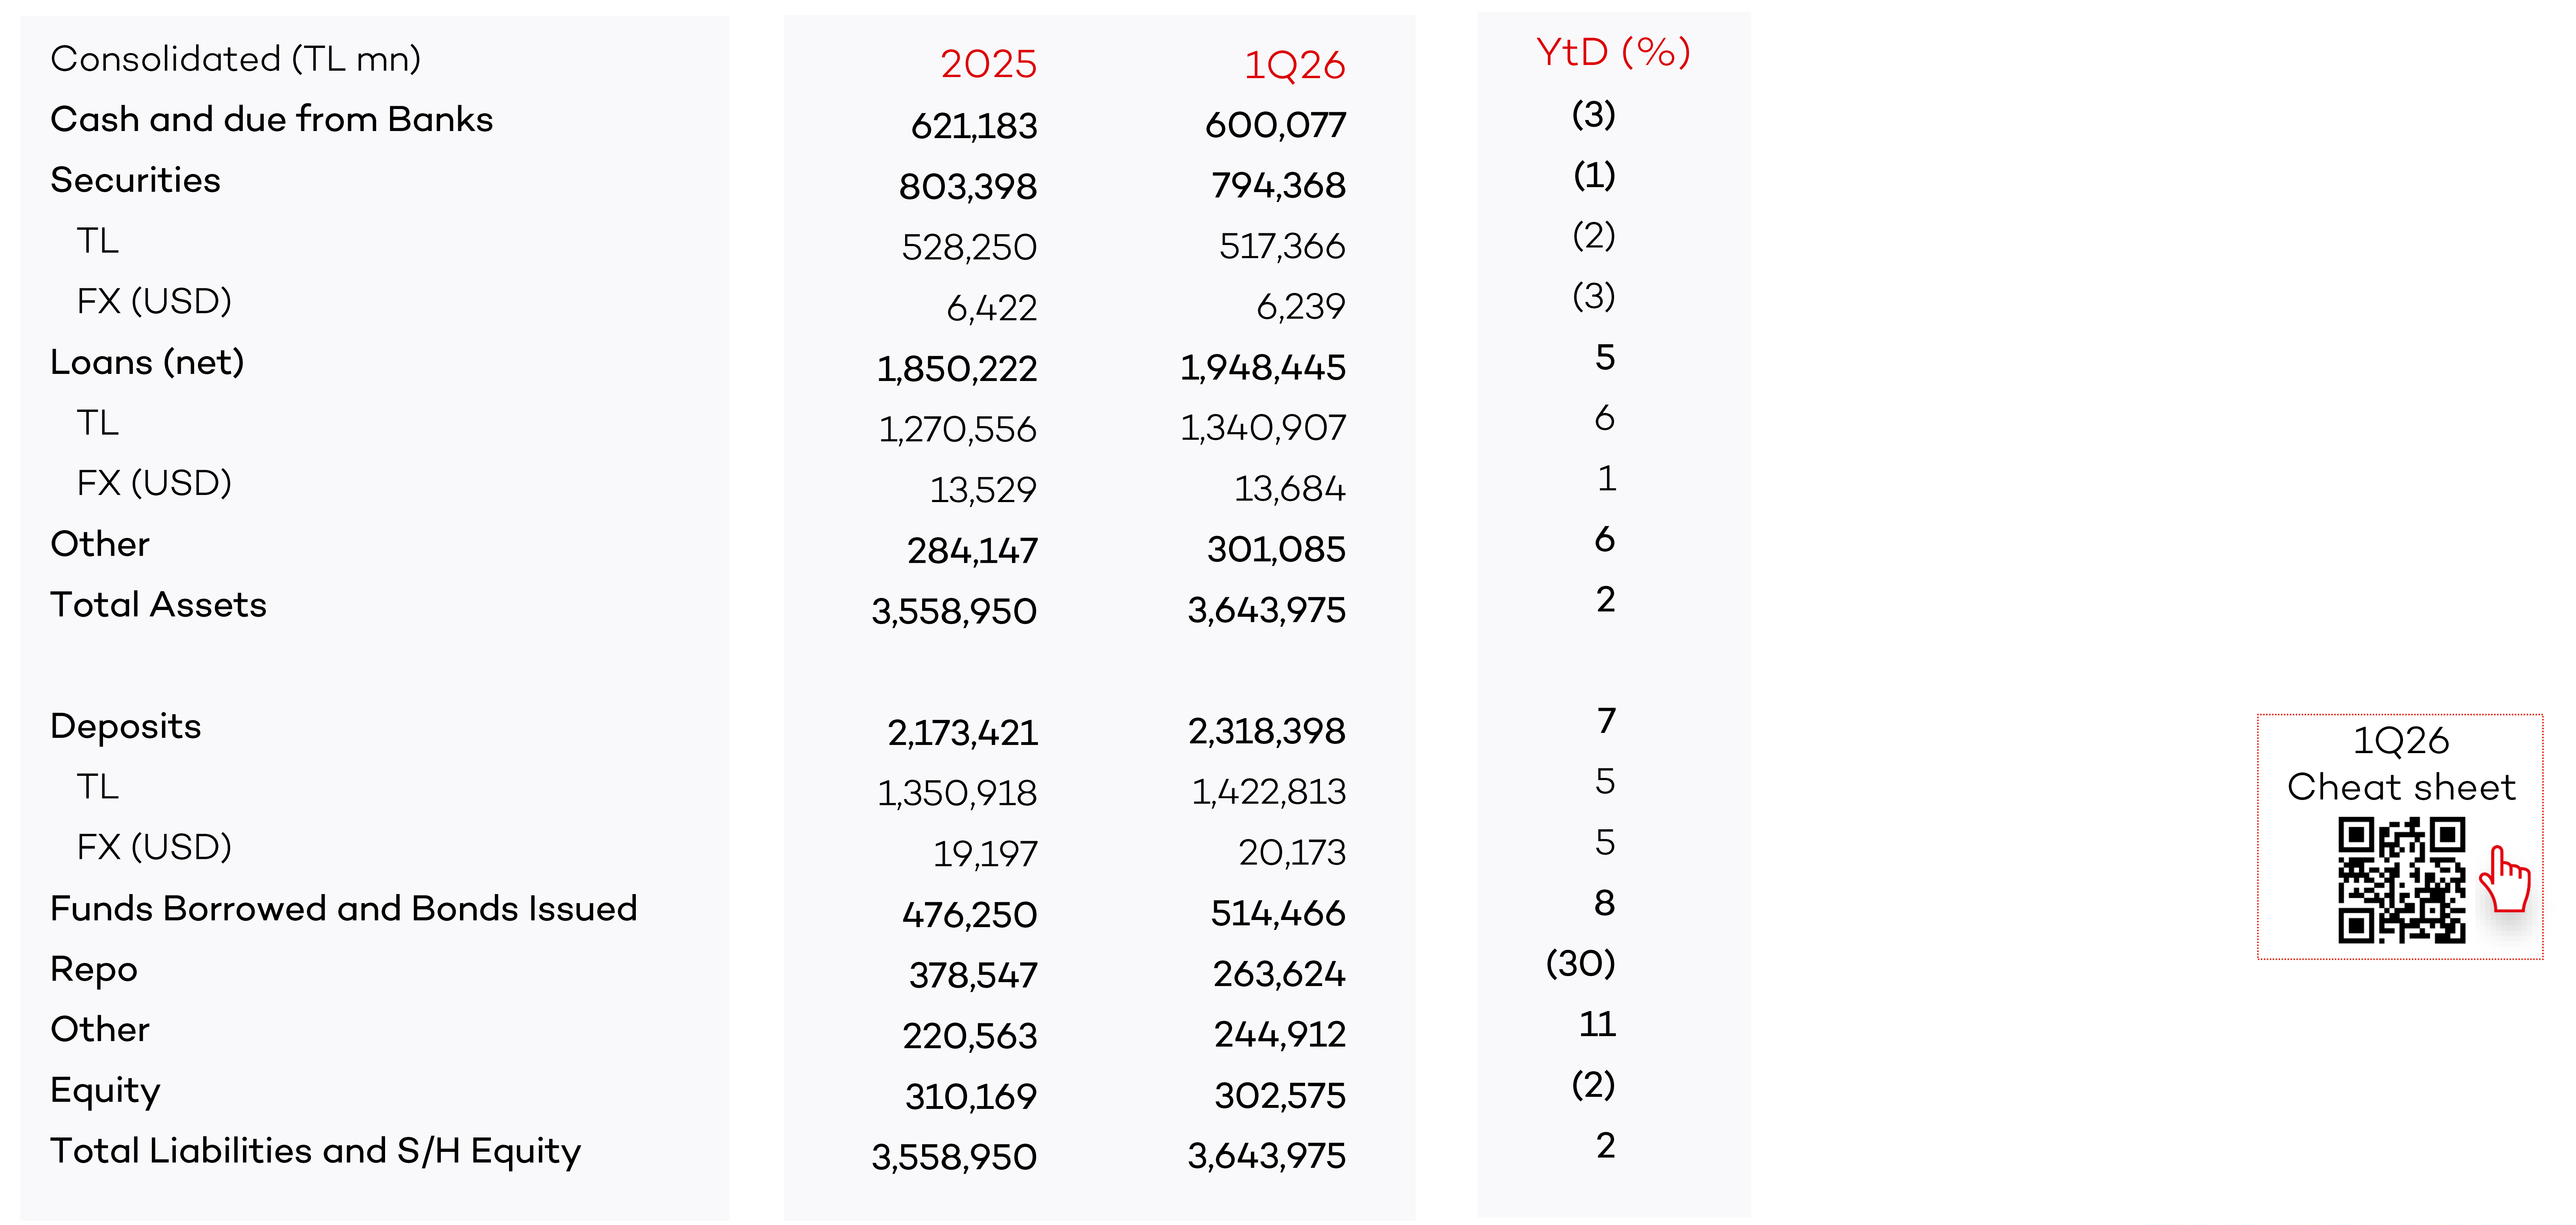
Balance Sheet Highlights

Consolidated(TLmn) 2022 9M23 2023 QoQ(%) YoY(%)
CashandduefromBanks 167,376 303,350 356,898 18 113
Securities 280,542 421,867 464,946 10 66
TL 183,659 277,265 319,253 15 74
FX(USD) 5,181 5,282 4,949 (6) (4)
Loans(net) 594,203 841,499 929,613 10 56
TL 393,861 559,398 636,089 14 62
FX(USD) 10,714 10,304 9,971 (3) (7)
Other 105,173 149,956 153,312 2 46
TotalAssets 1,147,294 1,716,672 1,904,769 11 66
Deposits 721,562 1,133,736 1,292,914 14 79
TL 370,274 653,652 766,344 17 107
FX(USD) 18,787 17,536 17,887 2 (5)
FundsBorrowedandBondsIssued 117,681 158,708 178,687 13 52
Repo 62,524 120,361 99,404 (17) 59
Other 91,920 113,829 122,546 8 33
Equity 153,606 190,039 211,219 11 38
TotalLiabilitiesandS/HEquity 1,147,294 1,716,672 1,904,769 11 66

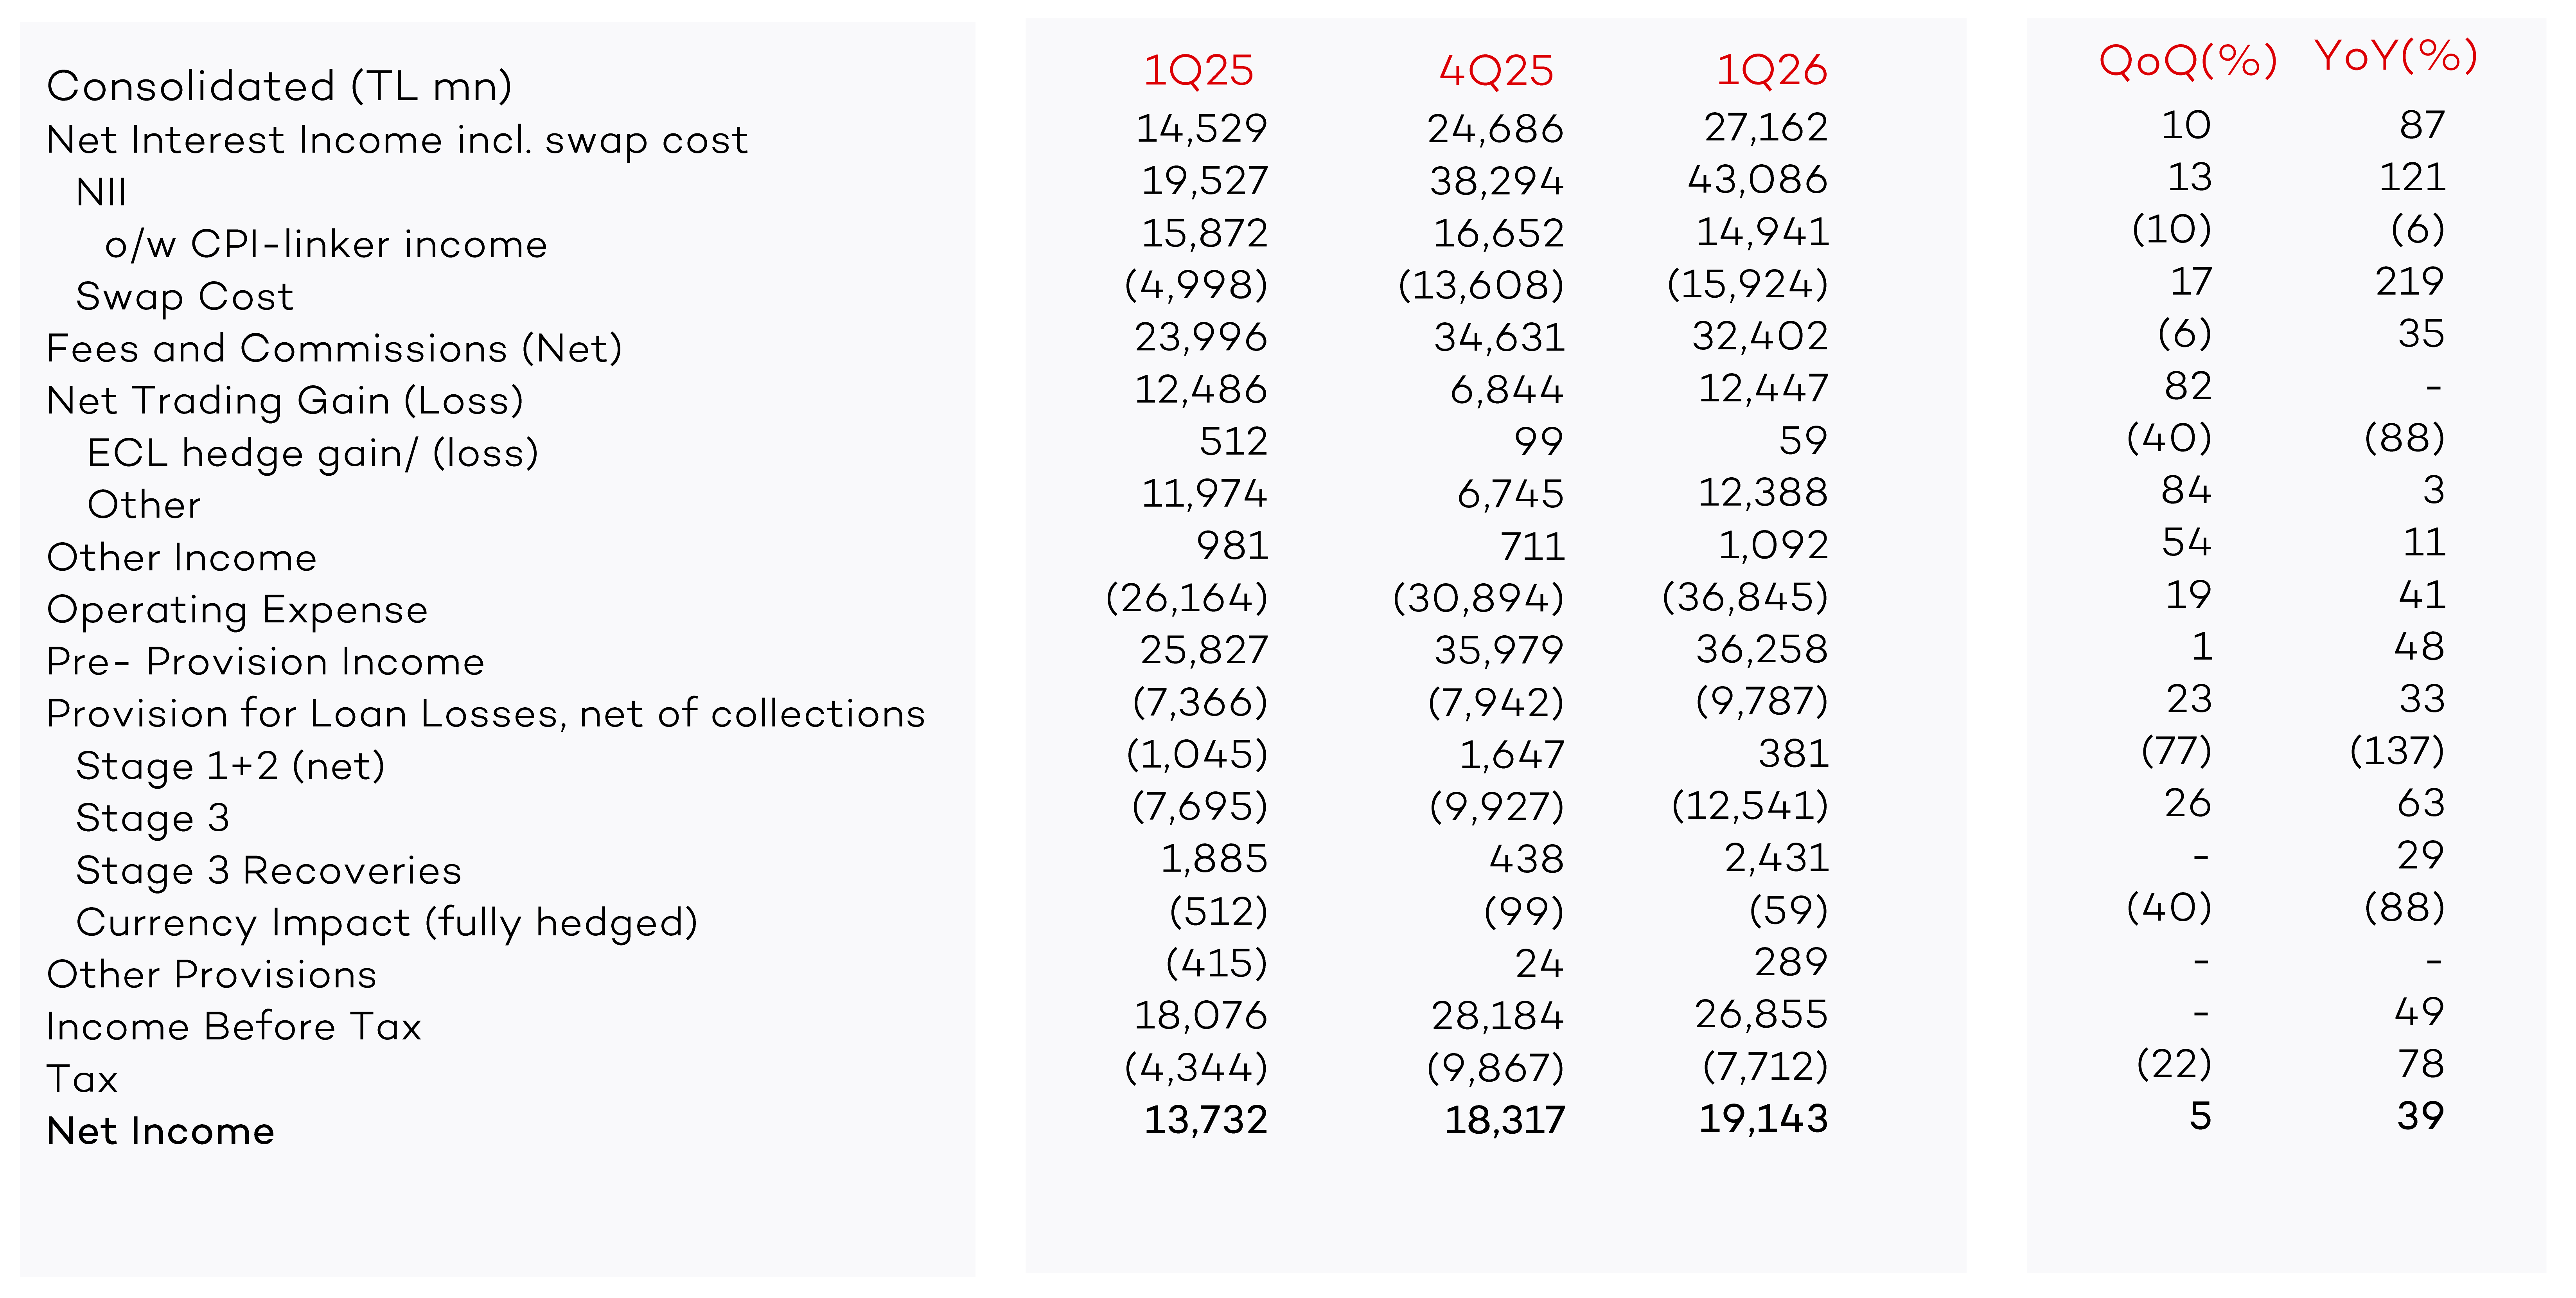
Income Statement Highlights

Consolidated(TLmn) 1Q23 2Q23 3Q23 4Q23 QoQ(%) 2022 2023 YoY(%)
NetInterestIncomeincl.swapcost 13,327 11,997 24,971 14,148 (43) 72,543 64,871 (11)
NII 13,740 11,375 24,731 19,023 (23) 79,084 68,869 (13)
o/wCPI-linkerincome 9,792 11,925 24,131 16,907 (30) 51,302 62,754 22
SwapCost (413) 622 240 (4,875) - (6,541) (3,998) (39)
FeesandCommissions(Net) 5,033 6,738 10,209 12,208 20 11,888 34,188 188
NetTradingGain(Loss) 6,894 20,557 10,181 7,901 (22) 23,345 45,103 93
LYYhedgegain/(loss) - - - - - 3,462 - -
ECLhedgegain/(loss) 166 1,559 240 653 172 1,370 2,618 91
Other 6,728 18,998 9,941 7,248 (27) 18,513 42,484 129
OtherIncome 424 216 307 710 132 1,303 1,657 27
OperatingExpense (10,267) (10,027) (12,394) (14,900) 20 (20,426) (47,588) 133
Pre-ProvisionIncome 15,411 29,480 33,272 20,066 (40) 88,654 98,230 11
ProvisionforLoanLosses,netofcollections (2,171) (3,471) (2,190) (3,115) 42 (4,074) (10,948) 169
Stage1+2(net) (1,885) (1,687) (1,523) (1,561) 3 (1,820) (6,656) 266
Stage3 (1,151) (929) (921) (3,296) 258 (3,581) (6,298) 76
Stage3Recoveries 1,030 704 494 2,396 385 2,697 4,624 71
CurrencyImpact(fullyhedged) (166) (1,559) (240) (653) 172 (1,370) (2,618) 91
OtherProvisions (154) (289) (308) 526 - (4,309) (225) (95)
LYYMtMgain/(loss) - - - - - (3,464) - -
FreeProvisions - - - - - - - -
Other (154) (289) (308) 526 - (845) (225) (73)
IncomeBeforeTax 13,086 25,723 30,778 17,504 (43) 80,271 87,092 8
Tax (2,375) (5,416) (10,328) (2,477) (76) (20,245) (20,596) 2
NetIncome 10,711 20,307 20,450 15,027 (27) 60,026 66,496 11
 
 
Was this helpful? Yes No