Snapshot of Results
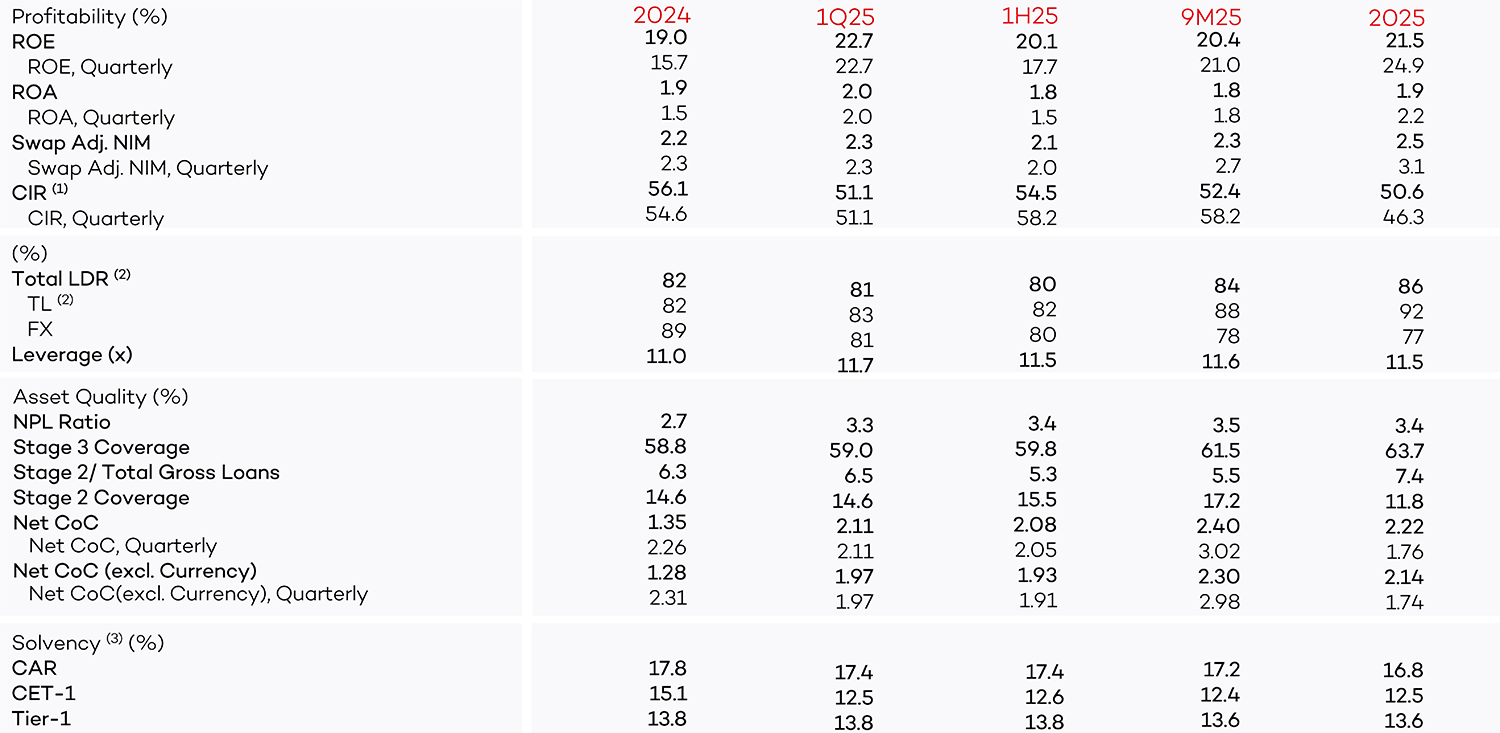
Profitability(%) |
1Q22 |
1H22 |
9M22 |
2022 |
1Q23 |
ROE |
38,6 |
47,1 |
51,5 |
54,7 |
27,9 |
ROE, Quarterly |
38,6 |
54,2 |
59,6 |
62,3 |
27,9 |
ROA |
4 |
4,9 |
5,6 |
6,2 |
3,6 |
ROA, Quarterly |
4 |
5,7 |
6,7 |
7,9 |
3,6 |
Swap Adj. NIM |
5,05 |
6,16 |
7,09 |
8,25 |
4,84 |
Swap Adj. NIM, Quarterly |
5,05 |
7,16 |
8,63 |
11,12 |
4,84 |
CIR (1) |
23,5 |
18,4 |
18,2 |
19 |
40,3 |
CIR, Quarterly |
23,5 |
16,4 |
18 |
19,4 |
40,3 |
(%) |
|
|
|
|
|
Total LDR (2) |
88 |
80 |
81 |
82 |
80 |
TL (2) |
133 |
122 |
119 |
106 |
96 |
FX |
53 |
47 |
46 |
51 |
54 |
Leverage (x) |
9,4 |
9,6 |
8,5 |
7,5 |
8,2 |
Asset Quality(%) |
|
|
|
|
|
NPL Ratio |
4 |
3,5 |
3,3 |
2,8 |
2,5 |
Stage 3 Coverage |
65,7 |
68,2 |
68,8 |
67,6 |
69,7 |
Stage 2/Total Gross Loans |
8,7 |
7,8 |
7,5 |
6,6 |
6,1 |
Stage 2 Coverage |
14,3 |
15,5 |
15,5 |
16,4 |
18,5 |
Net CoC |
1,07 |
0,85 |
0,78 |
0,81 |
1,35 |
Net CoC, Quarterly |
1,07 |
0,65 |
0,66 |
0,89 |
1,35 |
Net CoC (excl. Currency) |
0,72 |
0,51 |
0,49 |
0,54 |
1,25 |
Net CoC(excl. Currency), Quarterly |
0,72 |
0,32 |
0,45 |
0,66 |
1,25 |
Solvency (3) (%) |
|
|
|
|
|
CAR |
17,7 |
18 |
19,3 |
20,9 |
18,6 |
CET-1 |
14,4 |
14,7 |
16,1 |
17,9 |
15,7 |
Tier-1 |
14,4 |
14,7 |
16,1 |
17,9 |
15,7 |
(1) CIR calculation excludes FX gain from hedge position related with stage 1&2 provisions
(2) Bank-only, TL LDR includes domestic TL bond issuances and merchant payables
(3) w/o forbearances: Fixing MtM losses of securities & FX rate for RWA calculation to 2021 average FX rate for 1Q22; fixing MtM losses of securities & FX rate for RWA calculation to 2021YE FX rate for 1H22, 9M22 and 2022; fixing MtM losses of securities & FX rate for RWA calculation to 2022YE FX rate for 1Q23
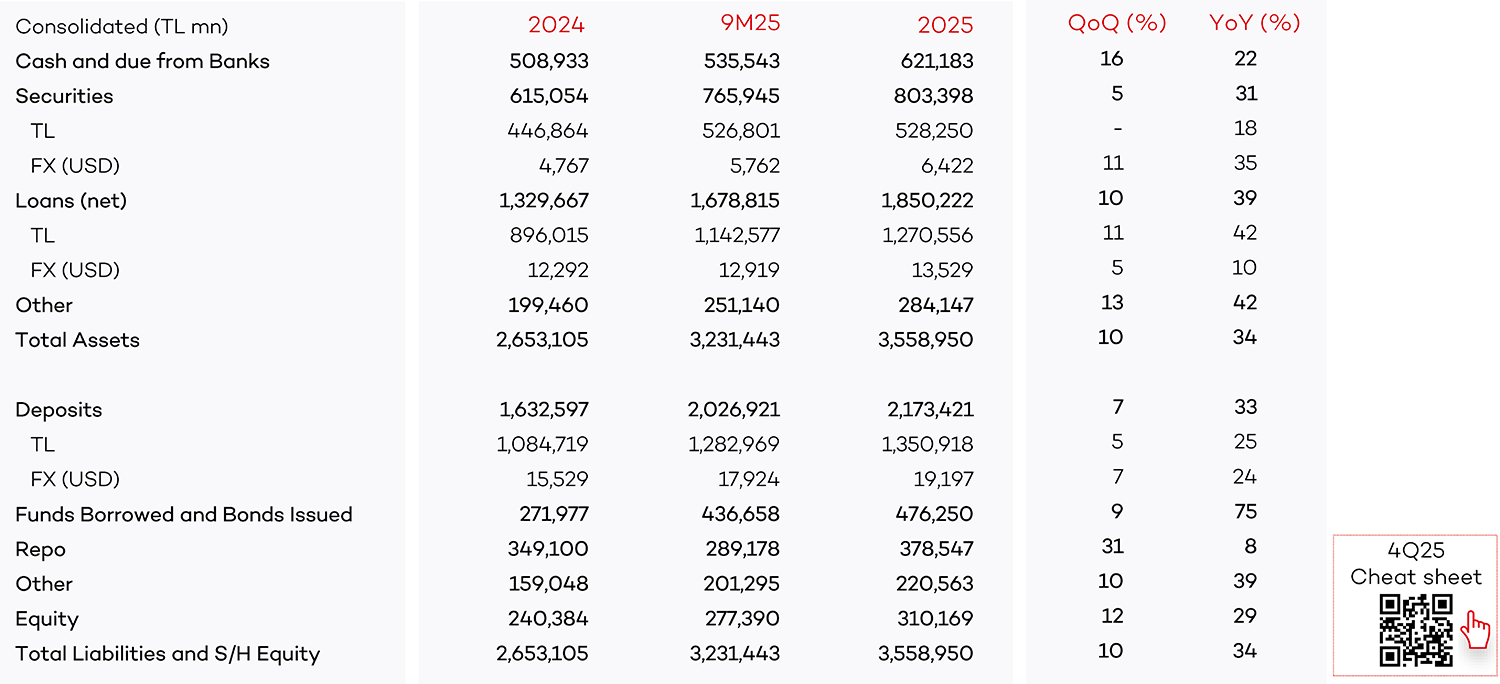
Balance Sheet Highlights
|
2022 |
1Q23 |
YtD (%) |
Consolidated (TL mn) |
|
|
|
Cash and due from Banks |
167,376 |
178,355 |
7 |
Securities |
280,542 |
316,949 |
13 |
TL |
183,659 |
214,025 |
17 |
FX (USD) |
5,181 |
5,457 |
5 |
Loans (net) |
594,203 |
653,340 |
10 |
TL |
393,861 |
450,096 |
14 |
FX (USD) |
10,714 |
10,777 |
1 |
Other |
105,173 |
110,631 |
5 |
Total Assets |
1,147,294 |
1,259,275 |
10 |
Deposits |
721,562 |
819,227 |
14 |
TL |
370,274 |
470,870 |
27 |
FX (USD) |
18,787 |
18,471 |
(2) |
Funds Borrowed and Bonds Issued |
117,681 |
119,852 |
2 |
Repo |
62,524 |
72,057 |
15 |
Other |
91,920 |
94,398 |
3 |
Equity |
153,606 |
153,741 |
- |
Total Liabilities and S/H Equity |
1,147,294 |
1,259,275 |
10 |
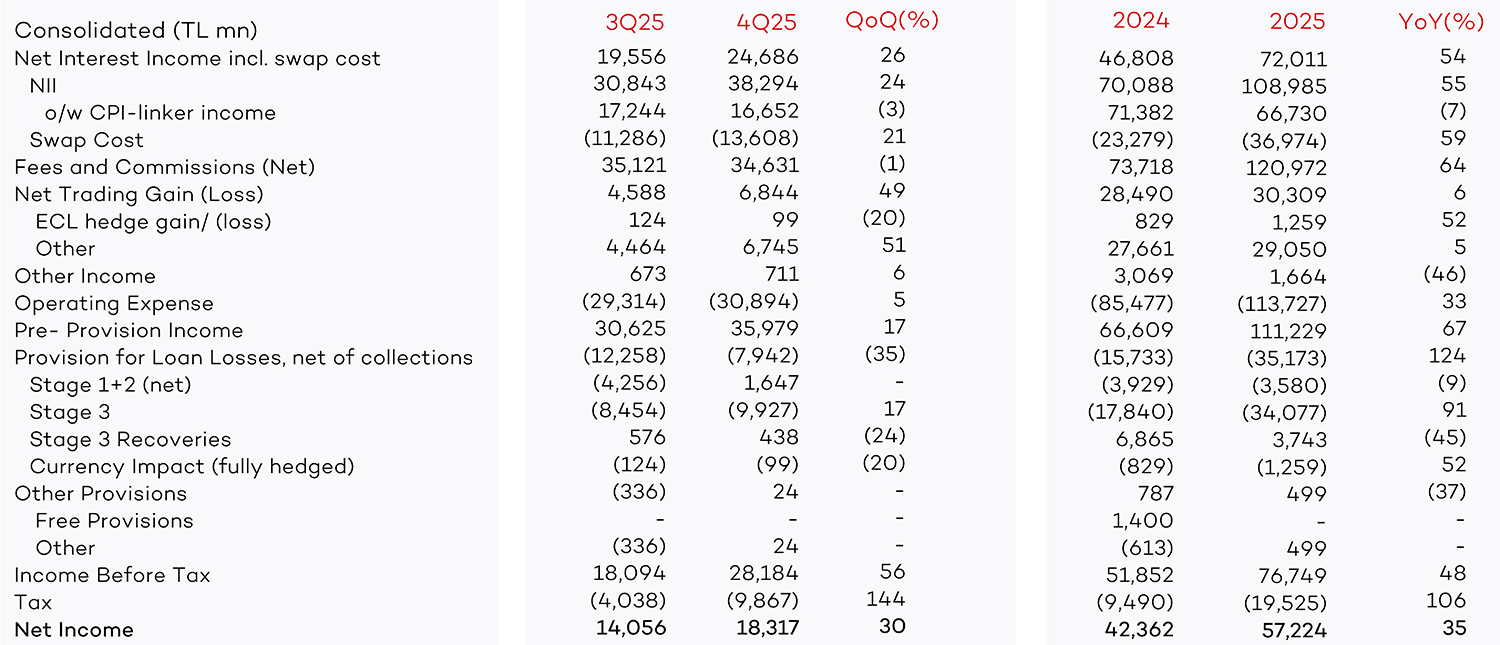
Income Statement Highlights
Consolidated (TL mn) |
1Q22 |
2Q22 |
3Q22 |
4Q22 |
1Q23 |
QoQ(%) |
YoY(%) |
Net Interest Income incl. swap cost |
9,411 |
15,038 |
20,085 |
28,009 |
13,327 |
(52) |
42 |
NII |
11,559 |
16,747 |
21,877 |
28,901 |
13,740 |
(52) |
19 |
o/w CPI-linker income |
5,591 |
9,579 |
14,228 |
21,903 |
9,792 |
(55) |
75 |
Swap Cost |
(2,148) |
(1,709) |
(1,792) |
(891) |
(413) |
(54) |
(81) |
Fees and Commissions (Net) |
2,048 |
2,579 |
3,105 |
4,156 |
5,033 |
21 |
146 |
Net Trading Gain (Loss) |
5,712 |
7,149 |
5,558 |
4,925 |
6,894 |
40 |
21 |
LYY hedge gain/ (loss) |
1,627 |
1,835 |
- |
- |
- |
- |
- |
ECL hedge gain/ (loss) |
366 |
394 |
270 |
340 |
166 |
(51) |
(55) |
Other |
3,720 |
4,920 |
5,288 |
4,585 |
6,728 |
47 |
81 |
Other Income |
276 |
349 |
363 |
316 |
424 |
34 |
54 |
Operating Expense |
(3,600) |
(4,058) |
(5,157) |
(7,611) |
(10,267) |
35 |
185 |
Pre- Provision Income |
13,846 |
21,058 |
23,955 |
29,795 |
15,411 |
(48) |
11 |
Provision for Loan Losses, net of collections |
(1,123) |
(780) |
(871) |
(1,300) |
(2,171) |
67 |
93 |
Stage 1+2 (net) |
(265) |
(391) |
(320) |
(844) |
(1,885) |
123 |
610 |
Stage 3 |
(1,153) |
(824) |
(684) |
(921) |
(1,151) |
25 |
- |
Stage 3 Recoveries |
661 |
829 |
402 |
805 |
1,030 |
28 |
56 |
Currency Impact (fully hedged) |
(366) |
(394) |
(270) |
(340) |
(166) |
(51) |
(55) |
Other Provisions |
(2,059) |
(2,328) |
(350) |
428 |
(154) |
- |
(93) |
LYY MtM gain/ (loss) |
(1,518) |
(1,946) |
- |
- |
- |
- |
- |
Free Provisions |
- |
- |
- |
- |
- |
- |
- |
Other |
(541) |
(382) |
(350) |
428 |
(154) |
- |
(93) |
Income Before Tax |
10,664 |
17,950 |
22,733 |
28,923 |
13,086 |
(55) |
23 |
Tax |
(2,615) |
(4,843) |
(5,677) |
(7,120) |
(2,375) |
(67) |
(9) |
Net Income |
8,049 |
13,107 |
17,066 |
21,803 |
10,711 |
(51) |
33 |