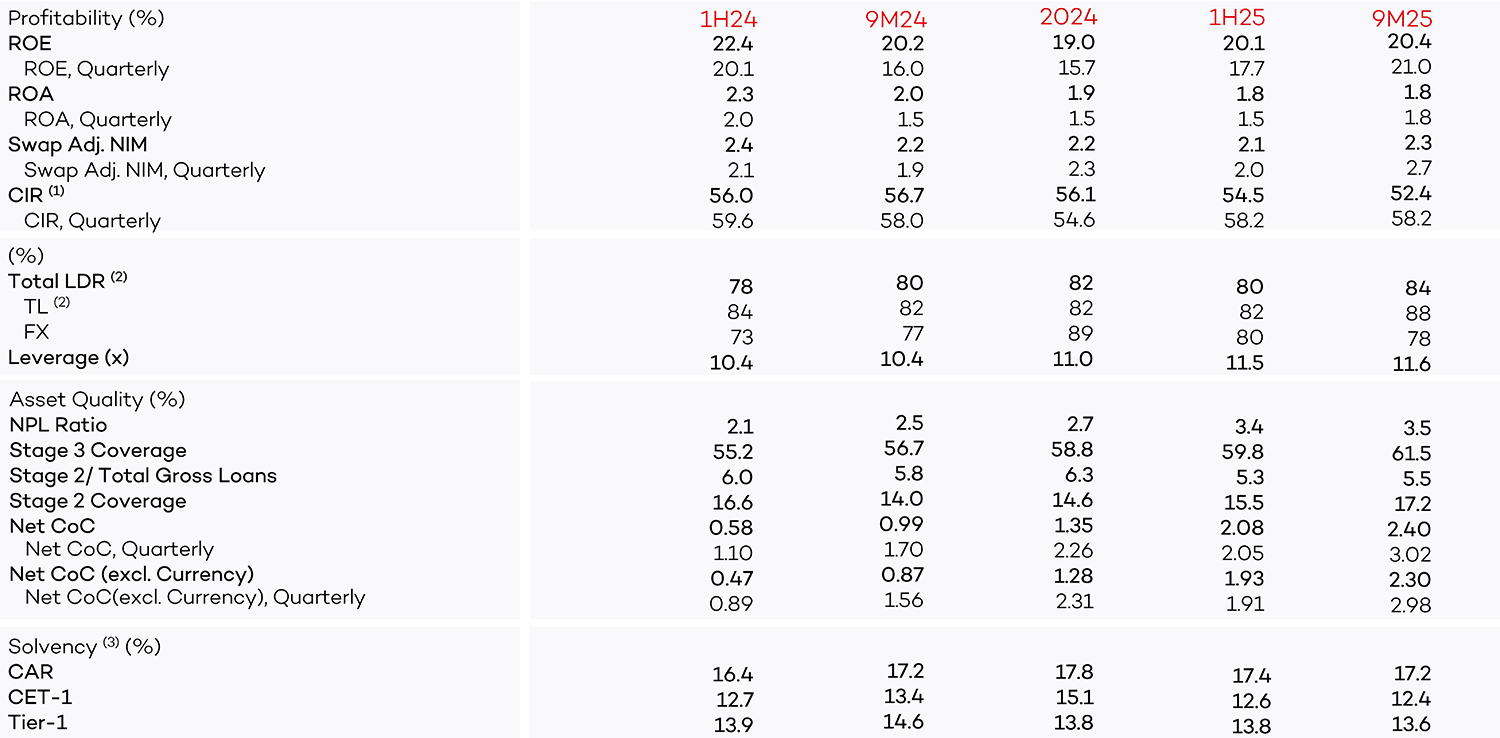
Snapshot of Results
Profitability (%) |
1H19 |
9M19 |
2019 |
1H20 |
9M20 |
ROE |
11,4 |
11,2 |
10,9 |
10,4 |
10,5 |
ROE, Quarterly |
10,4 |
10,8 |
10,0 |
11,4 |
10,5 |
ROA |
1,4 |
1,4 |
1,4 |
1,4 |
1,4 |
ROA, Quarterly |
1,3 |
1,4 |
1,4 |
1,5 |
1,3 |
Swap Adj. NIM |
3,86 |
3,95 |
4,14 |
4,63 |
4,28 |
Swap Adj. NIM, Quarterly |
3,91 |
4,13 |
4,71 |
4,42 |
3,67 |
CIR (1) |
33,8 |
34,0 |
32,9 |
31,6 |
32,3 |
CIR, Quarterly |
34,2 |
34,3 |
29,7 |
29,6 |
33,7 |
(%) |
|
|
|
|
|
Total LDR (2) |
95 |
90 |
91 |
98 |
93 |
TL (3) |
139 |
138 |
137 |
138 |
143 |
FX |
59 |
51 |
51 |
54 |
50 |
Leverage (x) |
7,6 |
7,4 |
7,1 |
7,7 |
8,2 |
Asset Quality (%) |
|
|
|
|
|
NPL Ratio |
4,5 |
6,0 |
6,6 |
6,2 |
5,8 |
Stage 3 Coverage |
59,2 |
58,1 |
56,2 |
61,5 |
62,9 |
Stage 2/ Total Gross Loans |
14,2 |
13,5 |
13,3 |
11,9 |
11,6 |
Stage 2 Coverage |
11,5 |
11,9 |
11,1 |
15,1 |
16,8 |
Solvency (4) (%) |
|
|
|
|
|
CAR |
17,7 |
19,5 |
19,7 |
20,4 |
19,1 |
CET-1 |
15,0 |
16,7 |
16,9 |
17,4 |
16,1 |
Tier-1 |
15,0 |
16,7 |
16,9 |
17,4 |
16,1 |
(1) CIR calculation excludes FX gain from long FX position related with stage 1&2 provisions and LYY hedge as well as insurance penalty of TL 71 mn & BRSA penalty of TL 117 mn
(2) Bank-only
(3) TL LDR includes domestic TL bond issuances and merchant payables
(4) 2020 figures are w/o forbearances that will end by YE2020 (Fixing MtM losses of securities & FX rate for RWA calculation to YE2019)
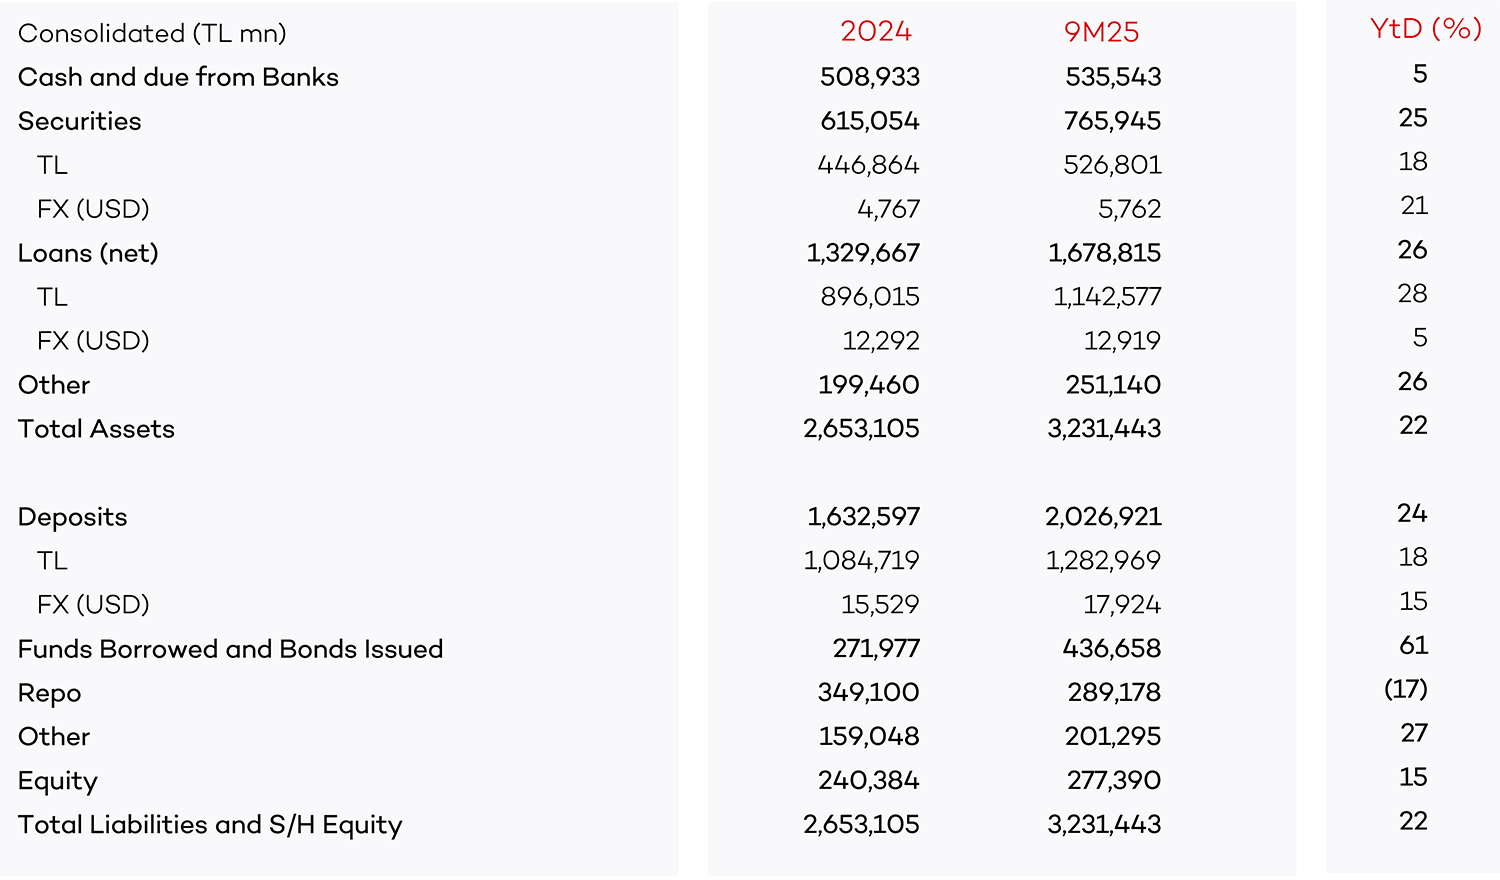
Balance Sheet Highlights
|
2019 |
1H20 |
9M20 |
QoQ (%) |
YtD (%) |
Consolidated (TL mn) |
|
|
|
|
|
Cash and due from Banks |
47.901 |
57.107 |
70.314 |
23 |
47 |
Securities |
83.635 |
100.108 |
100.483 |
- |
20 |
TL |
48.213 |
66.532 |
62.566 |
(6) |
30 |
FX (USD) |
5.983 |
4.907 |
4.891 |
- |
(18) |
Loans (net) |
214.471 |
238.540 |
258.717 |
8 |
21 |
TL |
133.307 |
153.489 |
161.085 |
5 |
21 |
FX (USD) |
13.710 |
12.429 |
12.594 |
1 |
(8) |
Other |
41.165 |
47.929 |
56.473 |
18 |
37 |
Total Assets |
387.172 |
443.684 |
485.986 |
10 |
26 |
Deposits |
244.712 |
259.245 |
294.332 |
14 |
20 |
TL |
95.854 |
104.488 |
106.601 |
2 |
11 |
FX (USD) |
25.145 |
22.615 |
24.217 |
7 |
(4) |
Funds Borrowed and Bonds Issued |
53.755 |
62.734 |
73.522 |
17 |
37 |
Repo |
10.107 |
34.326 |
24.968 |
(27) |
147 |
Other |
24.236 |
29.861 |
34.189 |
14 |
41 |
Equity |
54.362 |
57.518 |
58.975 |
3 |
8 |
Total Liabilities and S/H Equity |
387.172 |
443.684 |
485.986 |
10 |
26 |
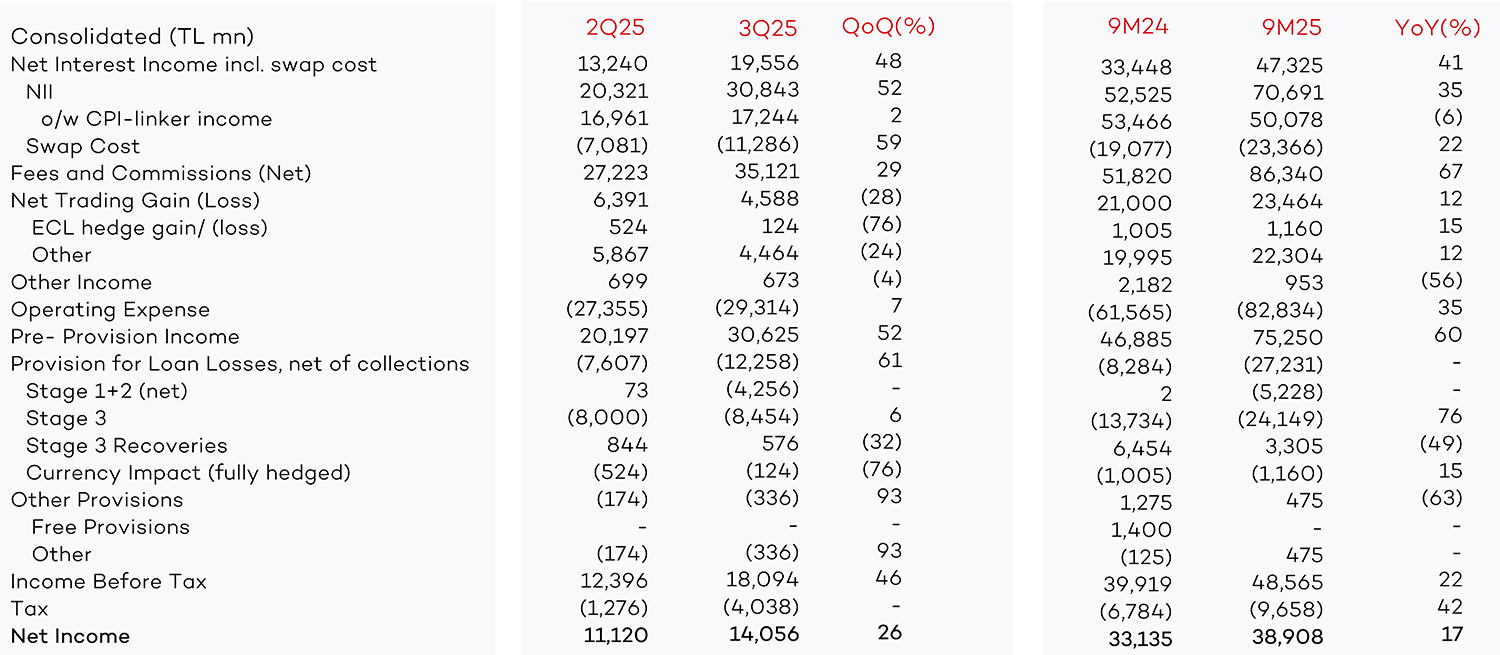
Income Statement Highlights
Consolidated (TL mn) |
2Q20 |
3Q20 |
QoQ(%) |
9M19 |
9M20 |
YoY(%) |
Net Interest Income incl. swap cost |
4.403 |
3.924 |
(11) |
10.090 |
12.830 |
27 |
NII |
4.993 |
4.900 |
(2) |
12.041 |
15.134 |
26 |
Swap Cost |
(590) |
(976) |
65 |
(1.951) |
(2.304) |
18 |
Fees and Commissions (Net) |
998 |
1.213 |
22 |
3.631 |
3.475 |
(4) |
Trading Gain (Loss) |
893 |
2.057 |
130 |
1.064 |
3.201 |
201 |
FX Gain (Loss) from Long Position (1) |
130 |
1.484 |
1.041 |
(59) |
1.798 |
- |
Securities |
314 |
(1) |
- |
175 |
291 |
66 |
Other |
449 |
575 |
28 |
947 |
1.112 |
17 |
Other Income |
67 |
40 |
(40) |
157 |
183 |
17 |
Operating Expense |
(1.843) |
(2.042) |
11 |
(5.092) |
(5.940) |
17 |
Pre- Provision Income |
4.518 |
5.192 |
15 |
9.849 |
13.749 |
40 |
Provision for Loan Losses, net of collections |
(1.837) |
(1.864) |
1 |
(3.565) |
(4.800) |
35 |
Stage 1+2 (net) |
(1.195) |
(1.021) |
(15) |
(690) |
(2.307) |
234 |
Stage 3 |
(680) |
(628) |
(8) |
(3.368) |
(2.450) |
(27) |
Stage 3 Recoveries |
169 |
256 |
52 |
435 |
742 |
71 |
Currency Impact (fully hedged) |
(130) |
(470) |
262 |
59 |
(785) |
- |
Other Provisions |
(594) |
(1.283) |
116 |
(1.074) |
(3.044) |
183 |
LYY MtM Loss |
(412) |
(1.057) |
156 |
(690) |
(2.341) |
239 |
Free Provisions |
- |
(250) |
- |
(100) |
(500) |
400 |
Other |
(181) |
25 |
- |
(284) |
(203) |
(29) |
Income Before Tax |
2.087 |
2.046 |
(2) |
5.210 |
5.907 |
13 |
Tax |
(504) |
(523) |
4 |
(1.182) |
(1.498) |
27 |
Net Income |
1.583 |
1.524 |
(4) |
4.028 |
4.409 |
9 |
(1) Including TL 1,013 mn FX gain from LYY hedging for 3Q20 and 9M20